After selection of image pairs covering the same area within the required time interval (2-9 days), image matching occurs on the geocoded images by a process of cross-correlation. A small image "chip" from the earlier image (typically 20x20km) is projected into the later image using a coarse estimate of ice motion from Ifremer's Merged Sea Ice Drift Vectors. The image chip is then scanned across a portion of the later image surrounding the estimated position (typically about 46x46km) and the position of best match (correlation) is found.
Data Products
Ice Motion
Eulerian Ice Motion - Image Pair
GlobICE product name: EULIMGPAIR
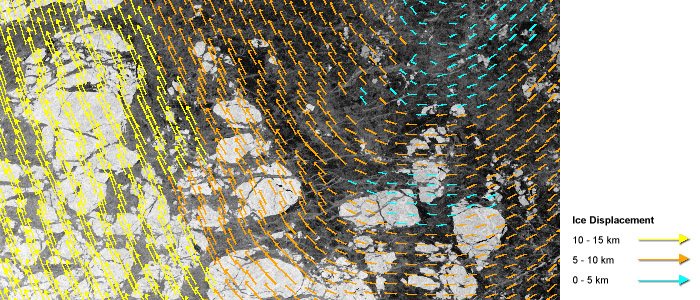
Image chip matching is performed for every point on a grid spaced at every 50 pixels (5km) in the earlier image. This produces an output grid of ice displacement vectors consisting of magnitude and direction components, which comprise the Image Pair product. The correlation value of each match is recorded with the displacement vector and forms the basis of the quality flags in the Image Pair product.
Displacement vectors plotted over Envisat ASAR image.
Eulerian Ice Motion Velocity - Gridded Average (3-day and monthly)
GlobICE product names: EULAVRVEL3, EUAVRVELM
Ice motion vectors from the Image Pair products are used to compute the Arctic-wide Ice Motion Velocity Gridded Average products for 3-day and one-month periods. The 3 day product is on a 5km grid, and the monthly product is on a 50km grid.
Lagrangian Ice Motion
GlobICE product name: LAGRANGIAN
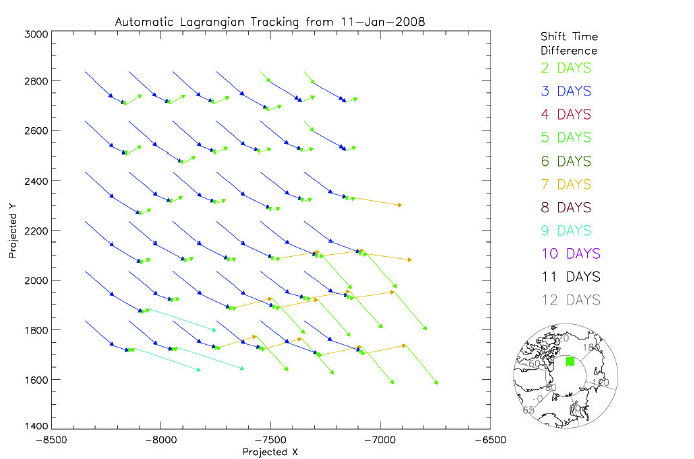
Initial displacement vectors on a 5km grid from the Image Pair products are used to track ice features for as long as possible. Each new displacement vector creates a new track recording time and location. Subsequent image pair matches in the same area add further time-stamped locations to the track. Tracks stop when image matching is interrupted by gaps in image coverage. The Lagrangian Ice Motion product contains all the tracks across the whole Arctic for a period of one month.
Plot of the Lagrangian tracking of Envisat ASAR data starting from a Eulerian grid on 11 January 2008. The colour coding indicates the time step between successive points as shown in the key on the right.